bacterial community response to land use change in the amazon
Objective
Understand bacterial taxonomic responses to land use change using samples collected at the Amazon Rainforest Metagenomic Observatory. An additional objective was to understand the effect of rarefaction on statistical metrics of bacterial diversity.
Background
Data provided was obtained via a nested sampling scheme at each location, repeated once per year over three years time. Three location types were compared:
- Pasture (actively used for raising cattle)
- Primary Rainforest
- Secondary Rainforest (rainforest that was recently used as cattle pasture but had begun to grow back)
16s rRNA marker DNA was extracted from soil cores and sequenced using Roche 454 pyrosequencing technology. This project was a part of a mentored assignment for a graduate genomics course.
Methods
Using the University of Oregon’s ACISS TORQUE server all data was processed within the QIIME pipeline, and operations were run in parallel where available. Multiple operational taxonomic unit (OTU) tables were generated for comparison, and QIIME was used to create principal coordinate plots of this data. The effects of rarefaction were analyzed by performing multiple rarefactions at a range of sample depths, calculating the respective alpha diversity measure at each sample depth, and visualizing this data using R.
Results
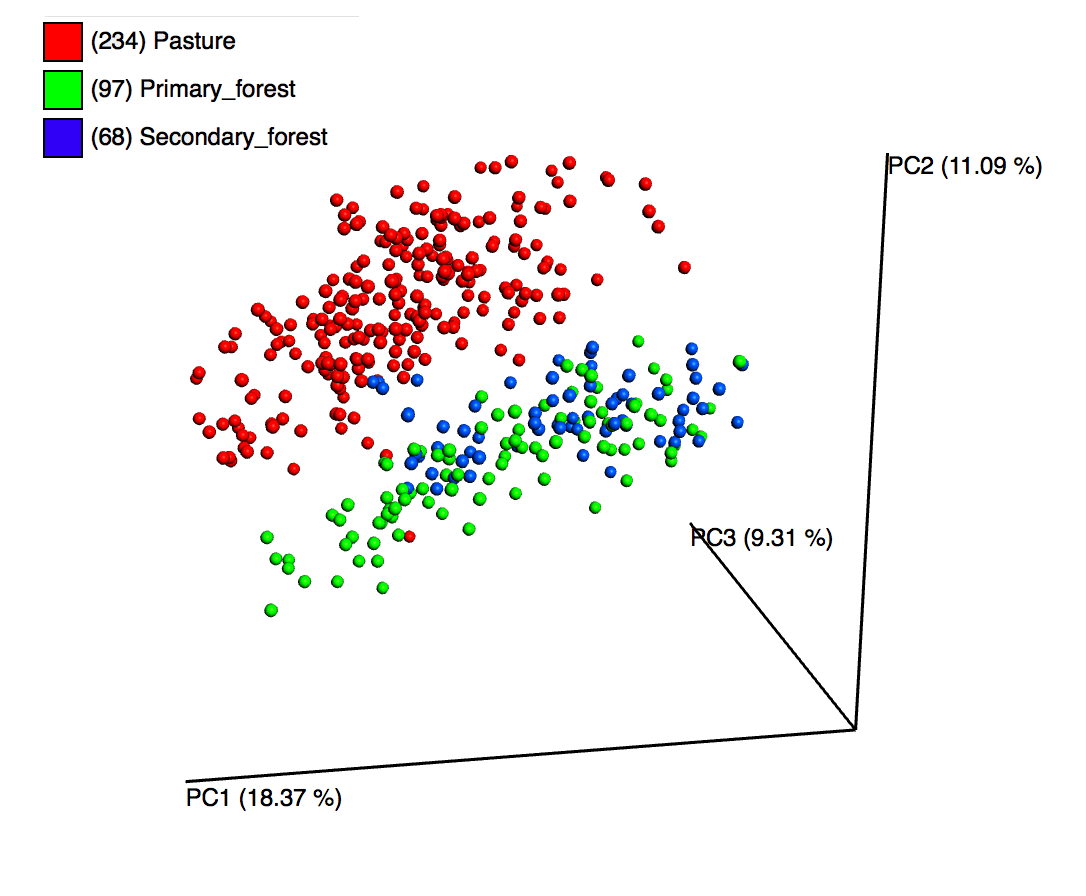
 The above plot is averaged across all years, and combines samples by the location type. As expected,
secondary forest points (in blue) show more taxonomic similarity to primary forest (green) than they do
pasture (red).
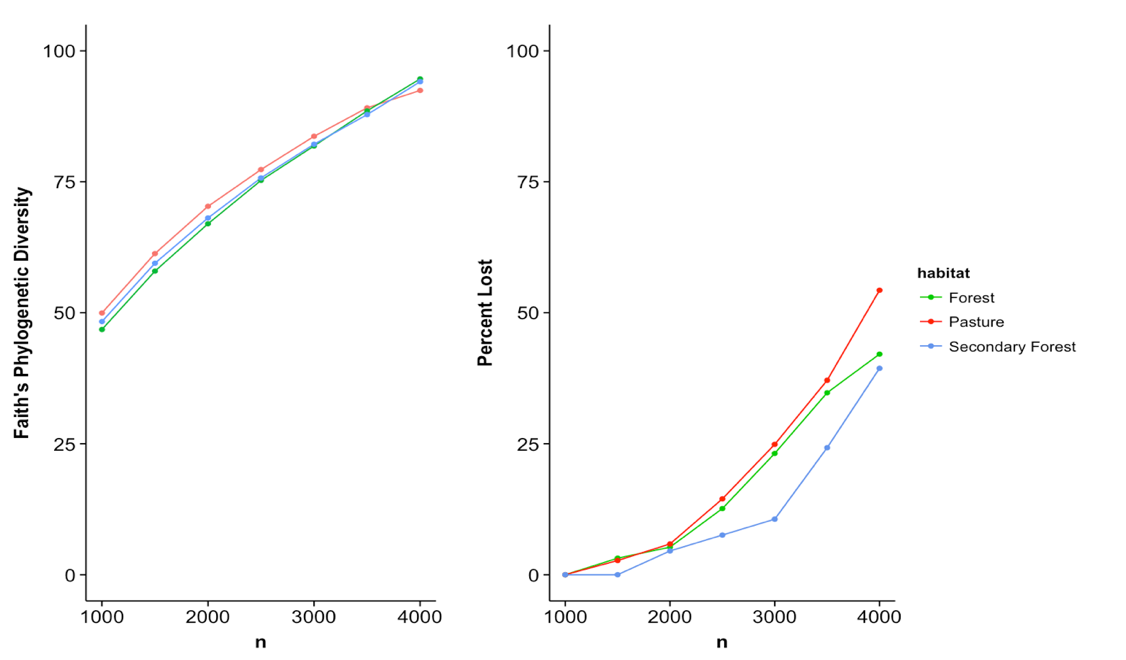
 The above plot highlights the effect that rarefaction has on measures of alpha diversity. At low sampling
depths the pasture samples appear to show more bacterial taxonomic diversity. However as the subsampling
depth increases the measure of diversity becomes more similar across land types.
Future
This was my first major foray into 16s rRNA amplicon studies, and with QIIME and it’s many dependencies. I became very interested in the idea of rarefaction and how this apparent “tossing out” of samples might either be necessary, or altering the outcome of statistical analyses, or both.
In the future I would like to look further into a chronosequence of this data, observing how taxonomic patterns change over time. In particular how quickly do the secondary forests “recover” to become more like the primary forest taxa? I believe this could be an excellent use for the R web application framework Shiny - to create an interactive, web-based visualization for this data.
