
examining gnobiotic effects in different populations of three-spined stickleback
Objective
Using a gnobiotic model of the three-spined stickleback fish, compare the effects of host population and their microbiota with the following factors, all at 14 days post-fertilization:
- Survival
- Sex of individuals
- Triglyceride concentration of host (whole body)
- Transcript abundance from host intestine
Background
All data was originally collected by the lab of Dr. William Cresko at the University of Oregon and was provided as a final project for a graduate course in advanced biological statistics. Two wild populations of three-spined stickleback were used (referred to as RS and BT) and both were bred to be germ-free (no microbiota). Each population contained two experimental groups: one remained germ-free, one where microbiota naturally present in facility food and water were introduced.
- RS: germ-free
- RS: conventional
- BT: germ-free
- BT: conventional
Methods
All data was processed in R, mostly using the package Vegan. These files can be provided upon request.
Results
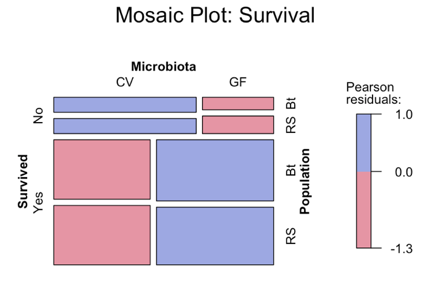
The above mossaic plot demonstrates that the most significant factor in survival was the microbiota, and not the original fish population. Fish with the “conventional” microbiota had lower overall survival rates than those with no microbiota at all.
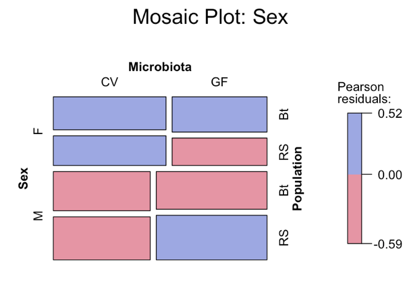
The above mossaic plot illustrates that sex is not significantly influenced by the population or the microbiota treatment.
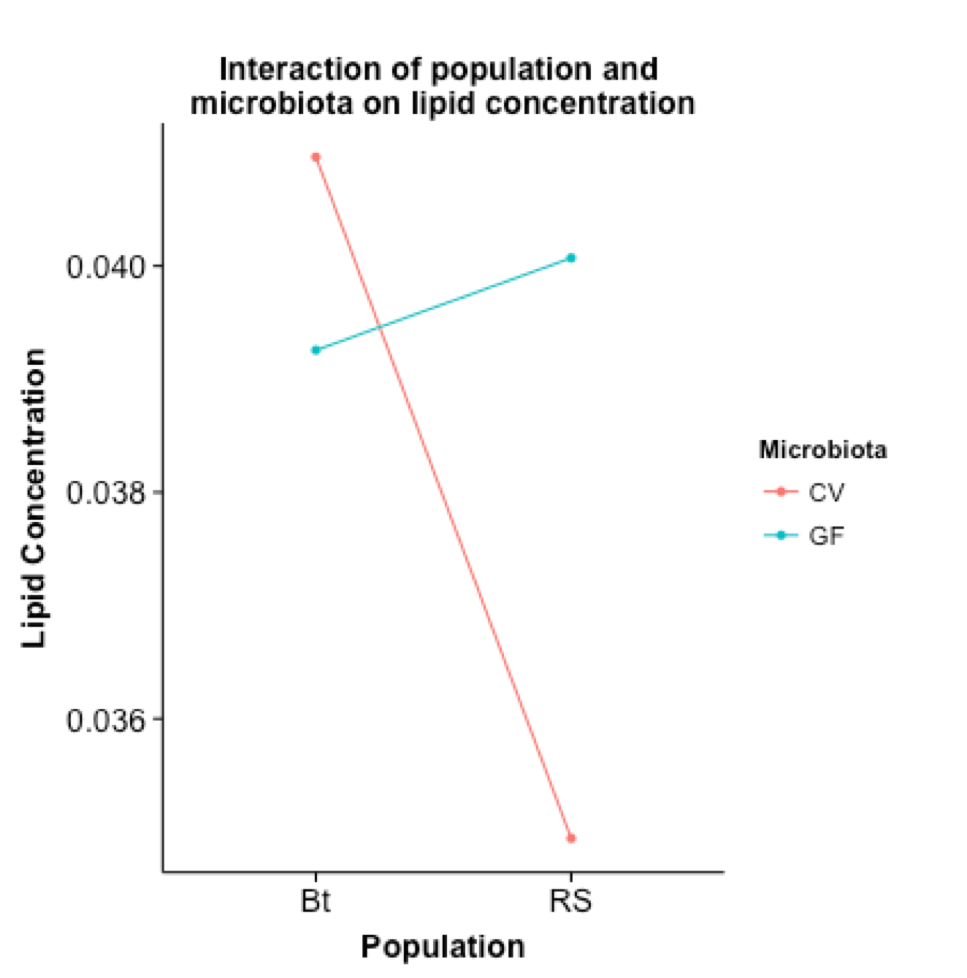
Results of a 2x2 factorial ANOVA are shown in the figure above, which highlights the interactions occurring between populations and microbiota treatments. Most notably, differential expression of TAGs was most significant across populations, and less so across microbiota treatments.
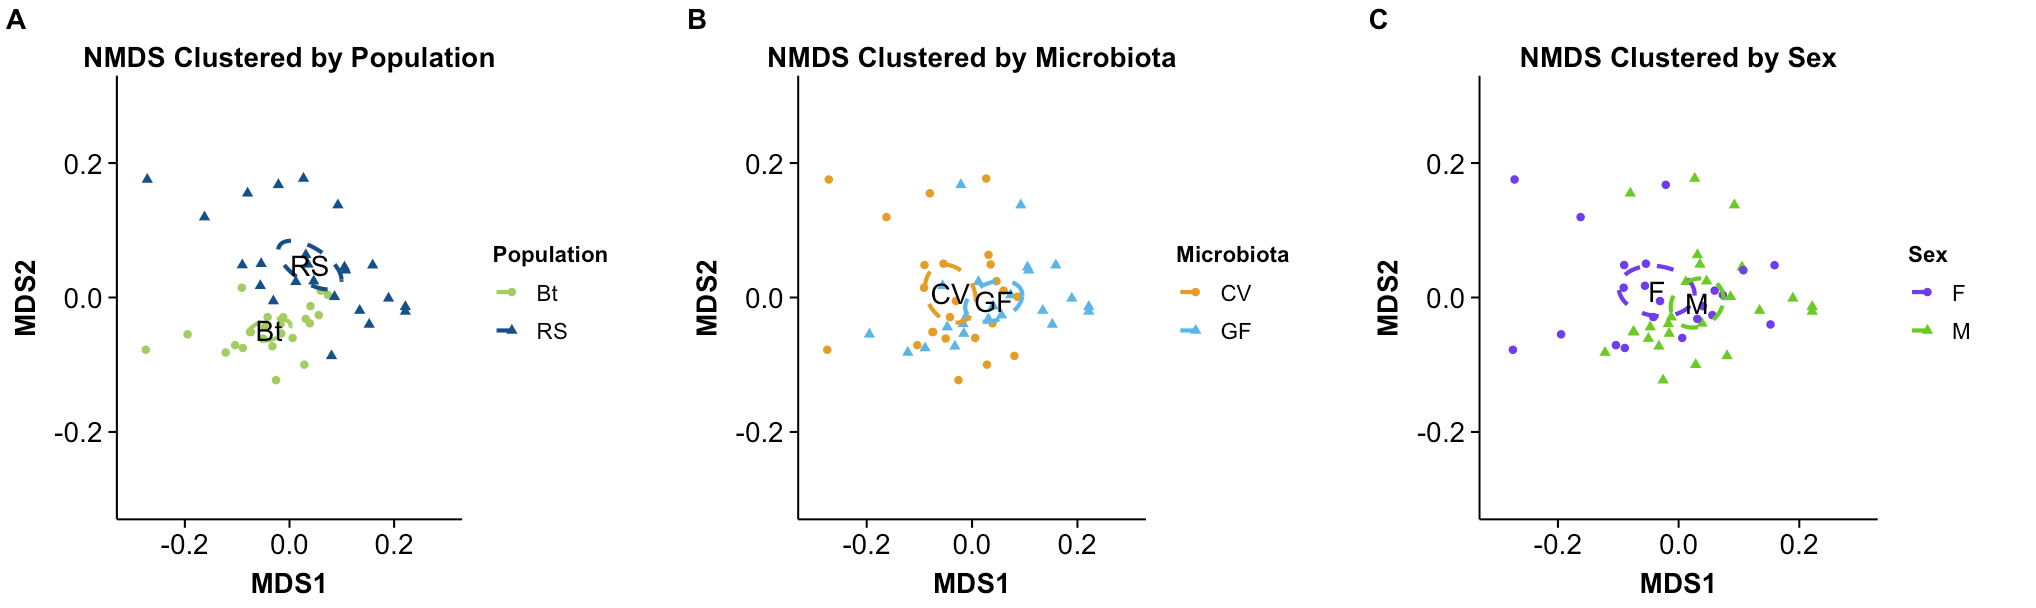
The figure above contains ordination plots containing the first two scaled dissimilarity values, including a comparison of different cluster analyses. This data shows a strong differentiation between populations, and slight trends for microbiota and sex.
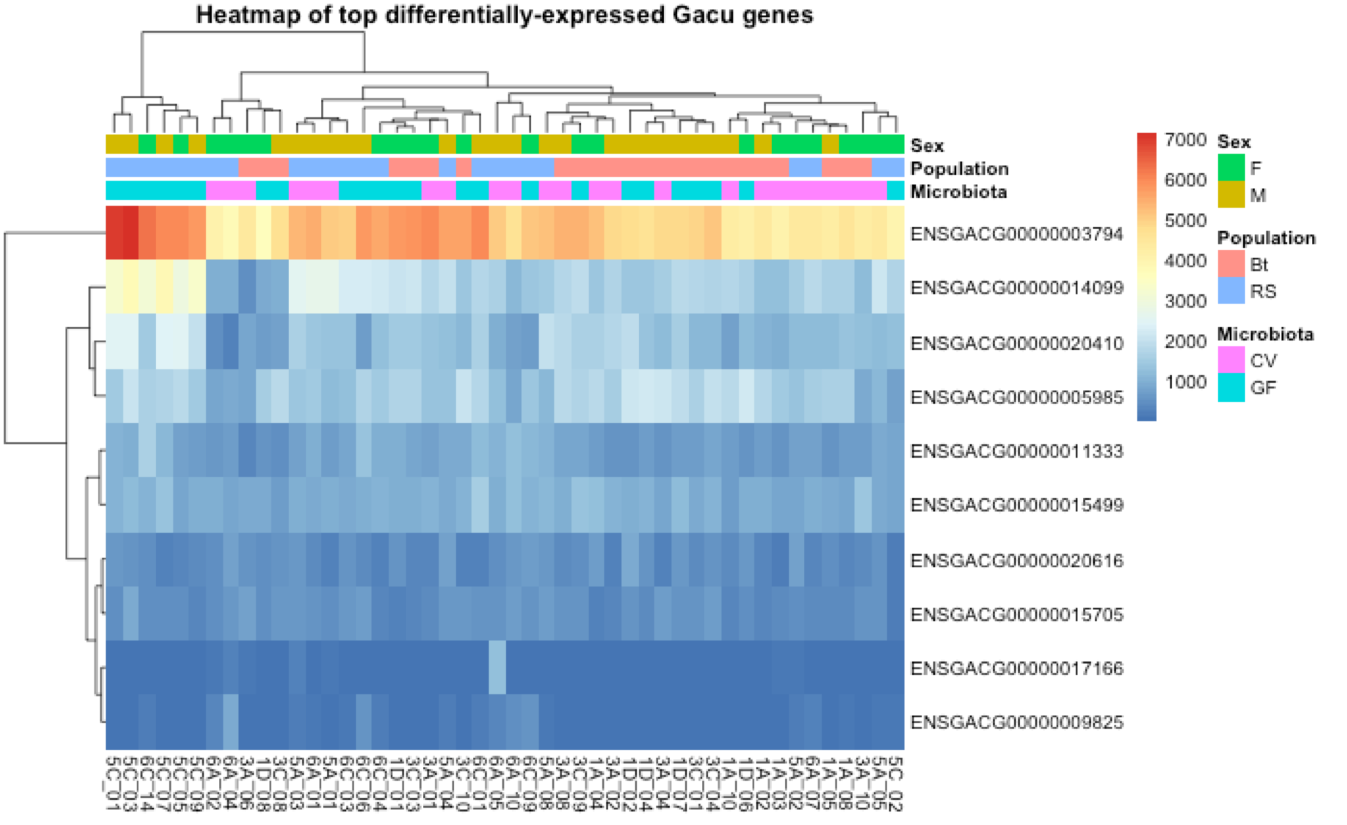
In order to further visualize differential gene expression, a heatmap was generated on a subset of ten genes most differentially expressed across samples. The figure above illustrates how these expression levels cluster with sex, population, and microbiota groups of the individuals.
Future
Since this data was provided for use in a biological statistics course, no further study is planned on my part. Feedback on my submission (which included analysis scripts as well as a formal write-up) was very positive. I did reflect in my conclusion that the low survivorship of the “conventional” treatment fish could have been related to potentially pathogenic microbes introduced in the food and water, but without samples from the tank water included in the data set that hypothesis can’t be confirmed.